
Stats Bar
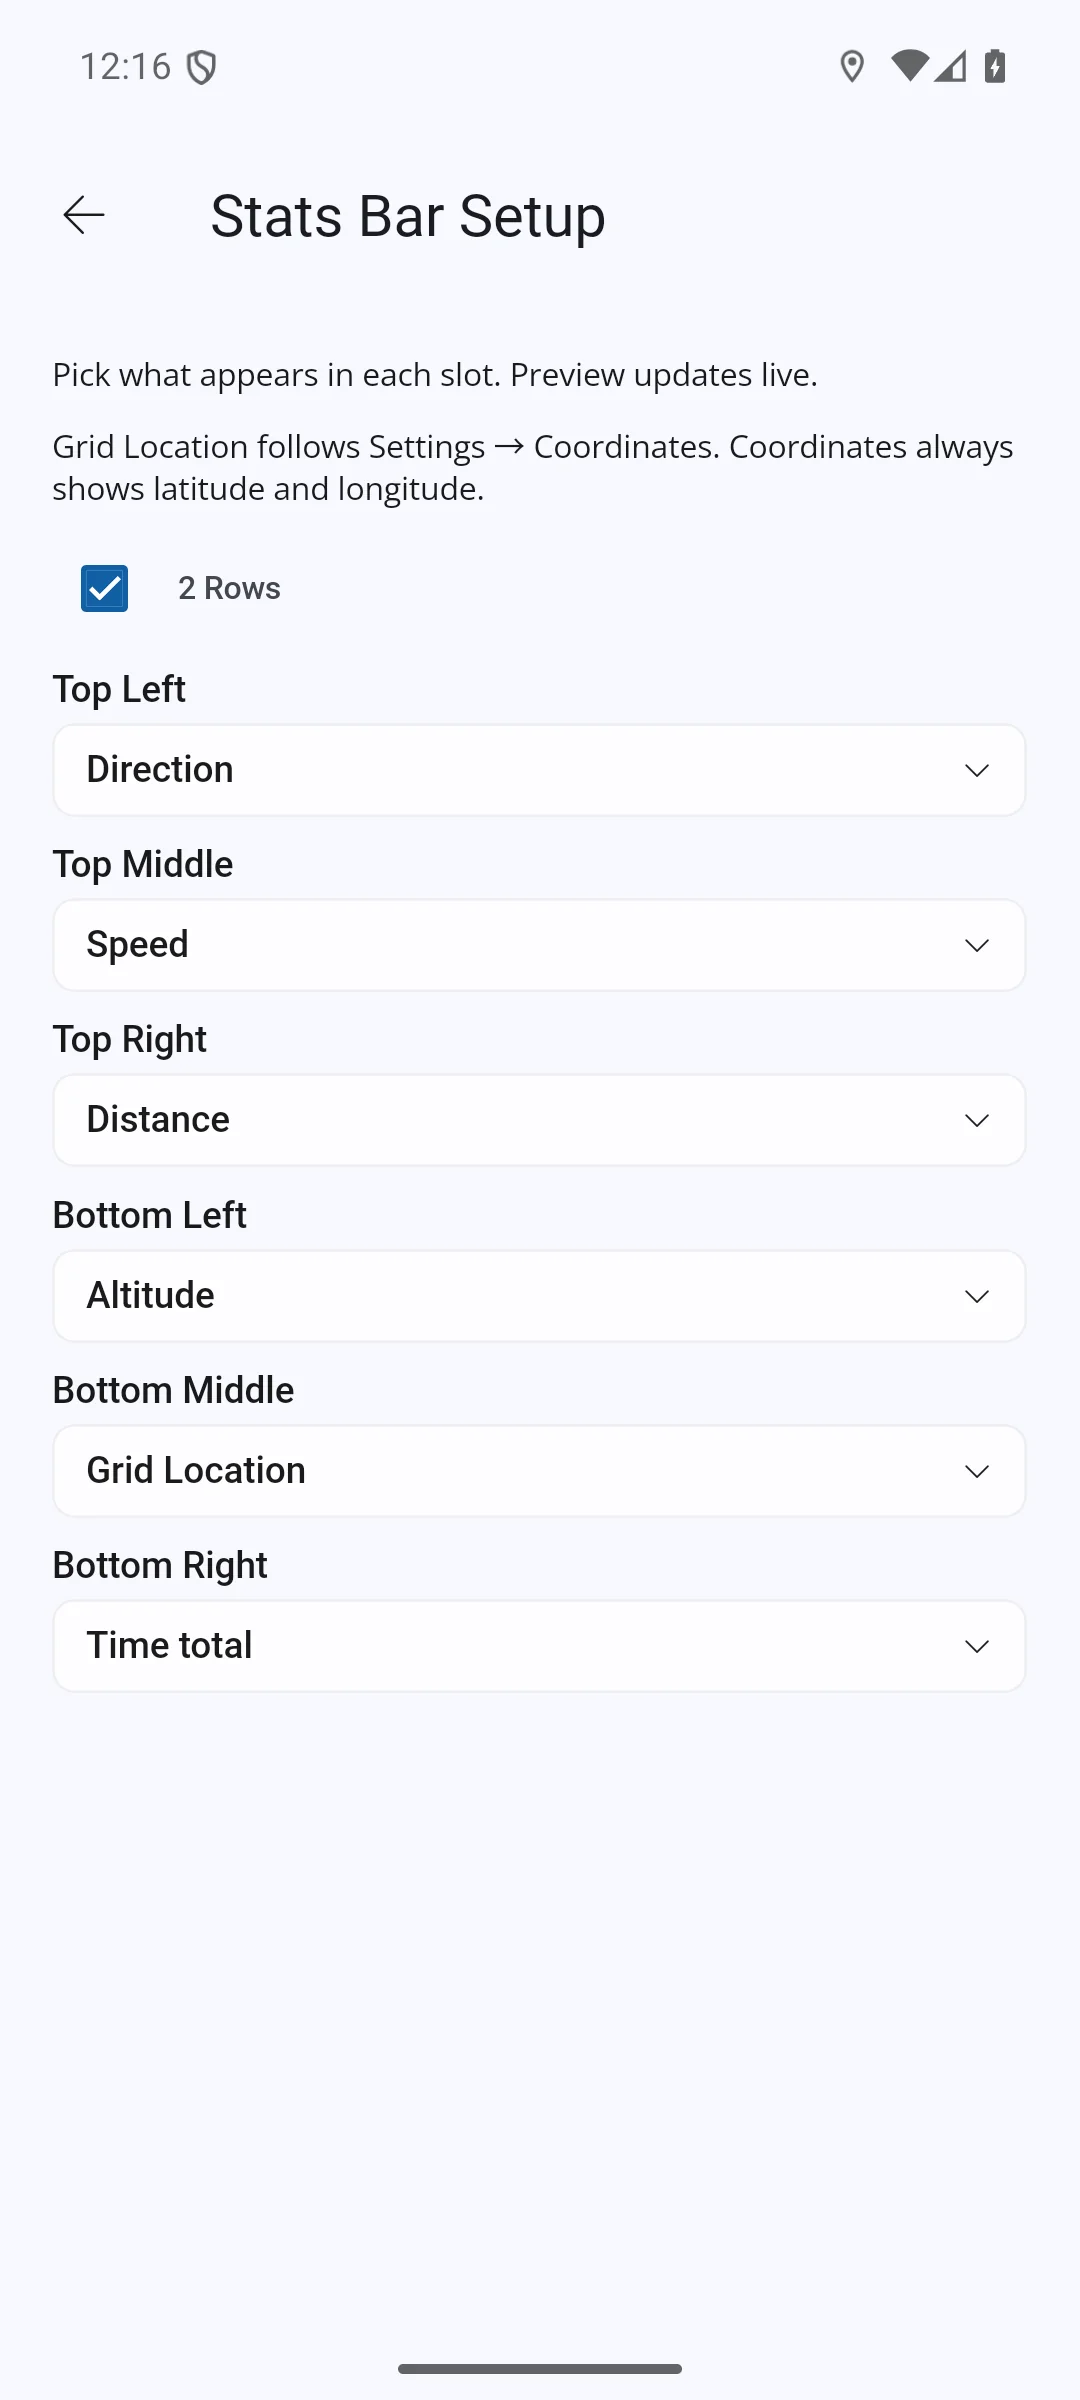
The Stats Bar shows live figures at the top of the mobile map screen. Use the S button to show or hide it, then tap the bar to open Stats Bar Setup. Choose one or two rows and the statistic shown in each position.
The Stats Bar is displayed and edited on iPhone, iPad and Android. Its visibility and layout sync with your account. Live location figures require a device with GPS and a usable fix; Tracklog figures require a recording or paused Tracklog.
Average Speed
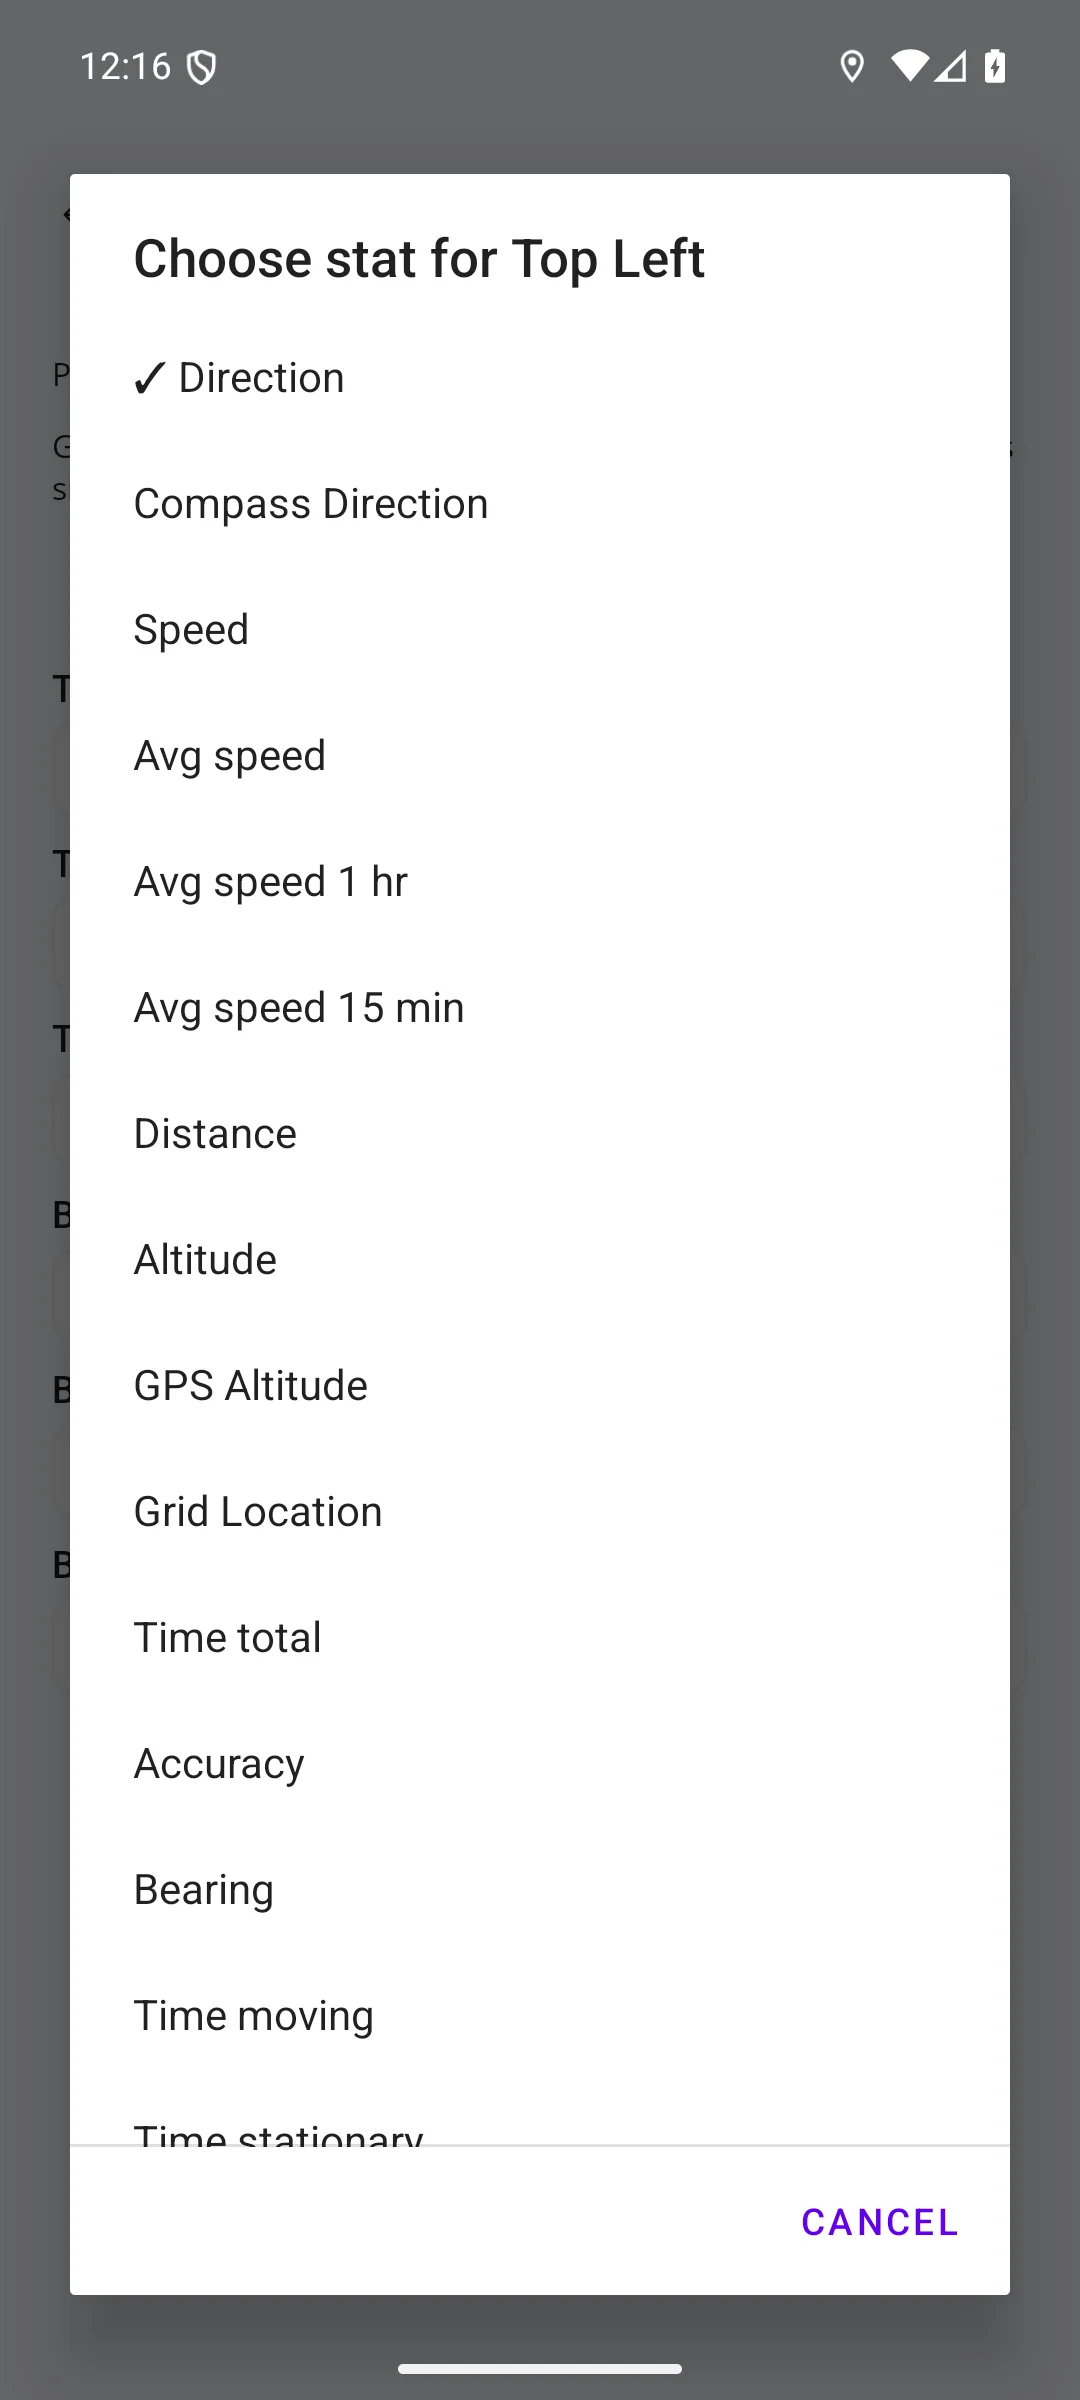
In Stats Bar Setup, tap a slot such as Top Left to open its list of statistics. The current choice has a tick. Choose one of these options:
| Option | What It Shows |
|---|---|
| Avg speed | Tracklog distance divided by Time total for the whole recording. |
| Avg speed 1 hr | Average over the last hour of Tracklog time. |
| Avg speed 15 min | Average over the last 15 minutes of Tracklog time. |
These averages exclude time when the Tracklog is paused, but include time when you stand still while recording. They use the Activity's distance filter, like the Distance figure. If the Tracklog is shorter than the chosen period, the average covers the recording so far.
A recent-period average needs the recorded points for that period. If they are unavailable, the figure shows --; this does not mean zero speed.
The saved Track's Stats view also shows Avg speed for total recording time and Avg speed (moving) for moving time. These can differ because the total-time average includes stops made while recording.
GPS Altitude
GPS Altitude shows the current GPS fix's altitude above mean sea level. It is different from terrain height taken from Height Data.
It shows -- when there is no usable live altitude. On Android it needs Android 14 or later and a fix supplying mean-sea-level altitude; it is unavailable on Android 13 and earlier. On iPhone and iPad, a fix with invalid altitude accuracy is not used. Downloading Height Data does not fill in a missing GPS altitude.
For terrain heights and profiles, see Height Data.